Completeness Metrics
The Completeness metric indicates how well the assignments within a schedule meet staffing requirements as defined by the Department Staffing Matrix and Forecast Census for
anticipated volume.
The Completeness score is calculated by adding the staffing variance (in hours) for each day in the schedule and dividing that total by the total number of staff hours required for the entire Schedule.
- Variance = Actual staff hours - Required staff hours
- Total Variance = The sum of all variances for all summary periods.
- Completeness Unit Score = Total Variance hours / Total required hours per schedule
Example:
Total Variance for all summary periods = 556 hours
Total required hours for the schedule period = 4293 hours
Unit Score: 556 / 4293 = 0.1295
- Important Note: Before the schedule is in Posted status, only the posted (theoretical) score displays for each metric. Once the schedule moves to Posted status, both the posted (theoretical)
and the actual, live metric scores display.
To view Completeness data:
- From the Schedule Quality Dashboard, click the Exceptions link to view a list of variances by day and summary period.
- From the Schedule Quality Dashboard, click Chart to view a bar chart representation of how closely actual staffing levels meet the requirements defined in the department staffing matrix.
- In the Chart toolbar, click the Show a graph for each drop down to change the chart view.
- Part of Day (default view) = Results for summary periods grouped by Day, Evening, and Night shift types.
- Summary = Results for each scheduling summary period by day.
Note: Shift Types are defined by department. To view or edit shift types, go to Departments > General Info.
Completeness Metrics: Part of Day Chart
- The toolbar displays how many pages are included in the report - one page for each part of day.
- In the toolbar, select a page from the drop-down or use the forward and back arrows to move to a different page.
- The report header lists the Metric, Schedule Period, Facility, and Department.
- The Part of Day and Score display above the bar chart.
- Each day in the schedule period is represented by a bar.
- Each bar is divided into scheduled skills.
- The legend below the bar chart lists the scheduled skills.
- Forecast and Actual staffing levels are plotted for each day.
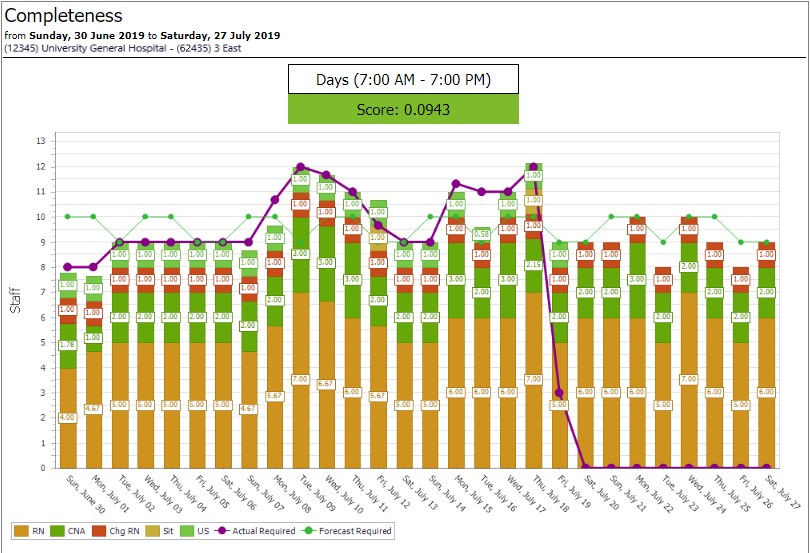
Example: Completeness Metrics by Part of Day
Completeness Metrics: Summary Chart
- The toolbar displays how many pages are included in the report - one page for each part of day.
- In the toolbar, select a page from the drop-down or use the forward and back arrows to move to a different page.
- The report header lists the Metric, Schedule Period, Facility, and Department.
- The Shift Summary Period time and Score display above the bar chart.
- Each day in the schedule period is represented by a bar.
- Each bar is divided into scheduled skills.
- The legend below the bar chart lists the scheduled skills.
- Forecast and Actual staffing levels are plotted for each day.
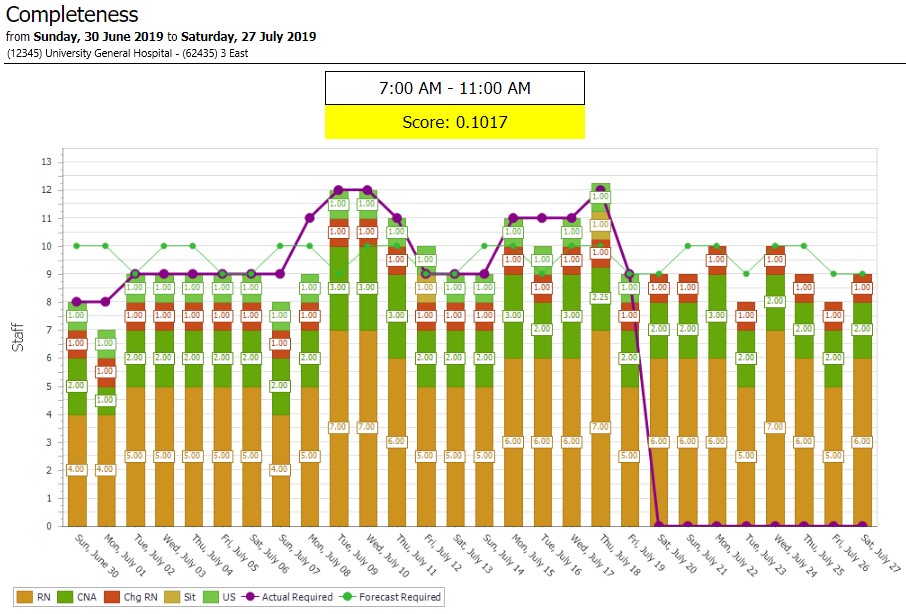
Example: Completeness Metrics by Shift Summary Period