Professional Completeness
The Professional Completeness metric indicates how well the professional staff assignments within a schedule meet staffing requirements as defined by the Department Staffing Matrix and Forecast Census for
anticipated volume.
To view Professional Completeness data:
- From the Schedule Quality Dashboard, click the Exceptions link to view a list of scheduling variances by day and summary period.
- From the Schedule Quality Dashboard, click Chart to view a bar chart representation of how closely actual professional staffing levels meet the staffing requirements defined in the department staffing matrix.
- In the Chart toolbar, click the Show a graph for each drop down to change the chart view.
- Part of Day (default view) = Results for summary periods grouped by Day, Evening, and Night shift types.
- Summary = Results for each scheduling summary period by day.
Note: Shift Types are defined by department. To view or edit shift types, go to Departments > General Info.
Professional Completeness Metrics: Part of Day Chart
- The toolbar displays how many pages are included in the report - one page for each part of day.
- In the toolbar, select a page from the drop-down or use the forward and back arrows to move to a different page.
- The report header lists the Metric, Schedule Period, Facility, and Department.
- The Part of Day and Score display above the bar chart.
- Each day in the schedule period is represented by a bar.
- Each bar is divided into scheduled professional skills.
- The legend below the bar chart lists the scheduled professional skills.
- Forecast and Actual staffing levels are plotted for each day.
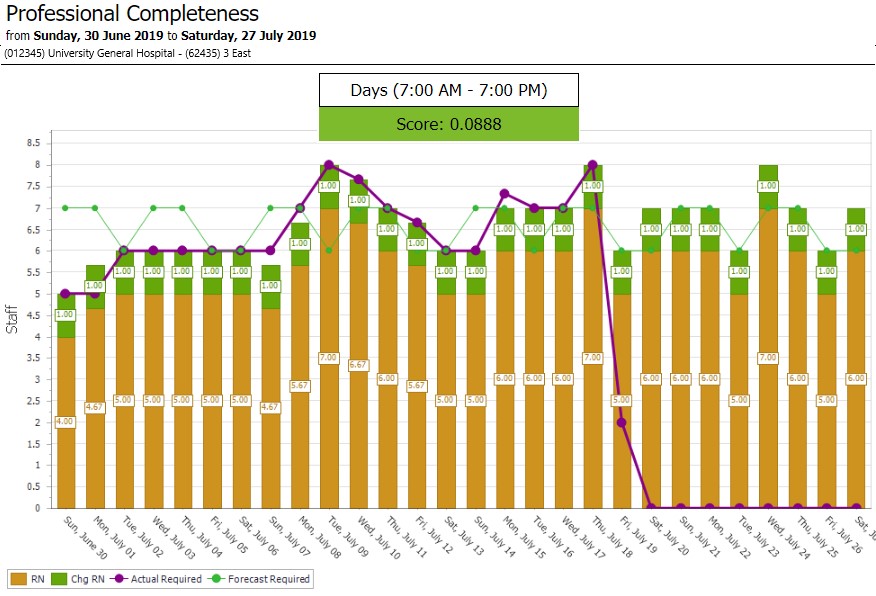
Example: Professional Completeness Metrics by Part of Day
Professional Completeness Metrics: Summary Chart
- The toolbar displays how many pages are included in the report - one page for each part of day.
- In the toolbar, select a page from the drop-down or use the forward and back arrows to move to a different page.
- The report header lists the Metric, Schedule Period, Facility, and Department.
- The Shift Summary Period time and Score display above the bar chart.
- Each day in the schedule period is represented by a bar.
- Each bar is divided into scheduled professional skills.
- The legend below the bar chart lists the scheduled professional skills.
- Forecast and Actual staffing levels are plotted for each day.
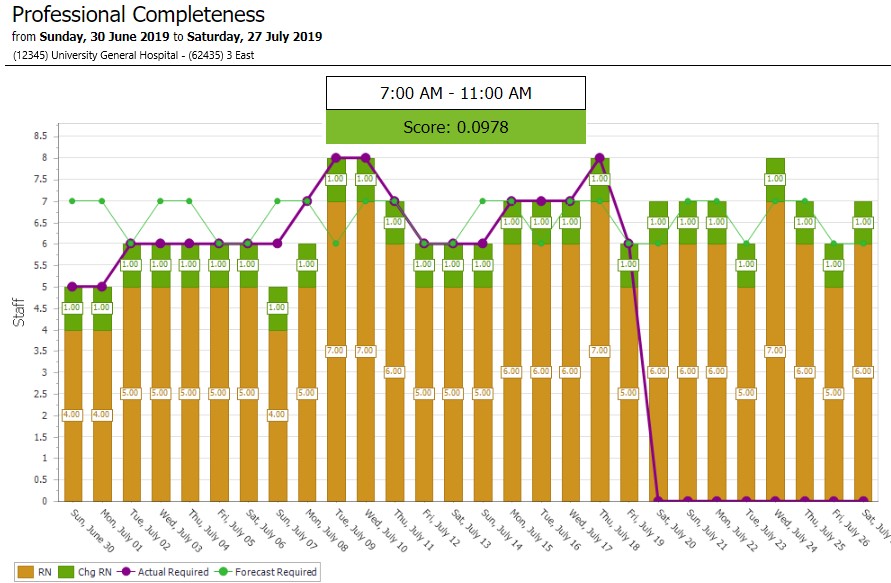
Example: Professional Completeness Metrics by Shift Summary Period